A few thousand installs can feel small when you compare your plugin with the biggest names in WordPress. Across the directory, that number looks different. Add the rating count, and you have a more useful comparison.
Our October 29 collection of WPInsight’s public directory mirror gives us four reference points:
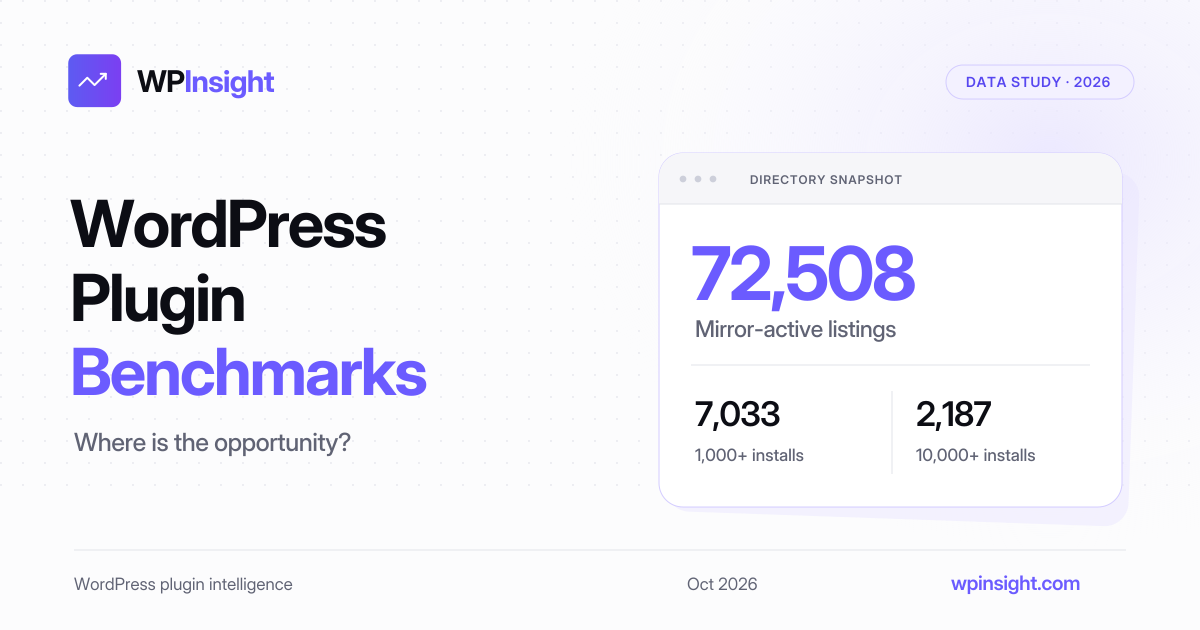
- 72,508 listings were marked active in the mirror.
- 7,033 reported at least 1,000 active installs.
- 3,268 reached 5,000+, or 4.51% of that population.
- Among the 7,033 listings at 1,000+, the median number of ratings was 17.
That is where I would start researching an opportunity. A plugin does not need millions of installs to be worth studying. We can look for a specific problem with evidence of use, then ask how much feedback supports the rating and what users actually value.
I’ve been building WPInsight since 2018. We used it internally for years, and now it is public. The goal here is to make the starting point more concrete: how many plugins reach each install bracket, how much rating history they have, and which smaller products combine a high score with a substantial number of ratings.
This analysis uses listings marked active in WPInsight’s mirror, not a live census of plugins currently available on WordPress.org. Mirror status can lag official closures. Install numbers are reported bracket floors, not exact users, customers or revenue. The distinction matters throughout the comparisons below.
A few thousand installs is a meaningful benchmark
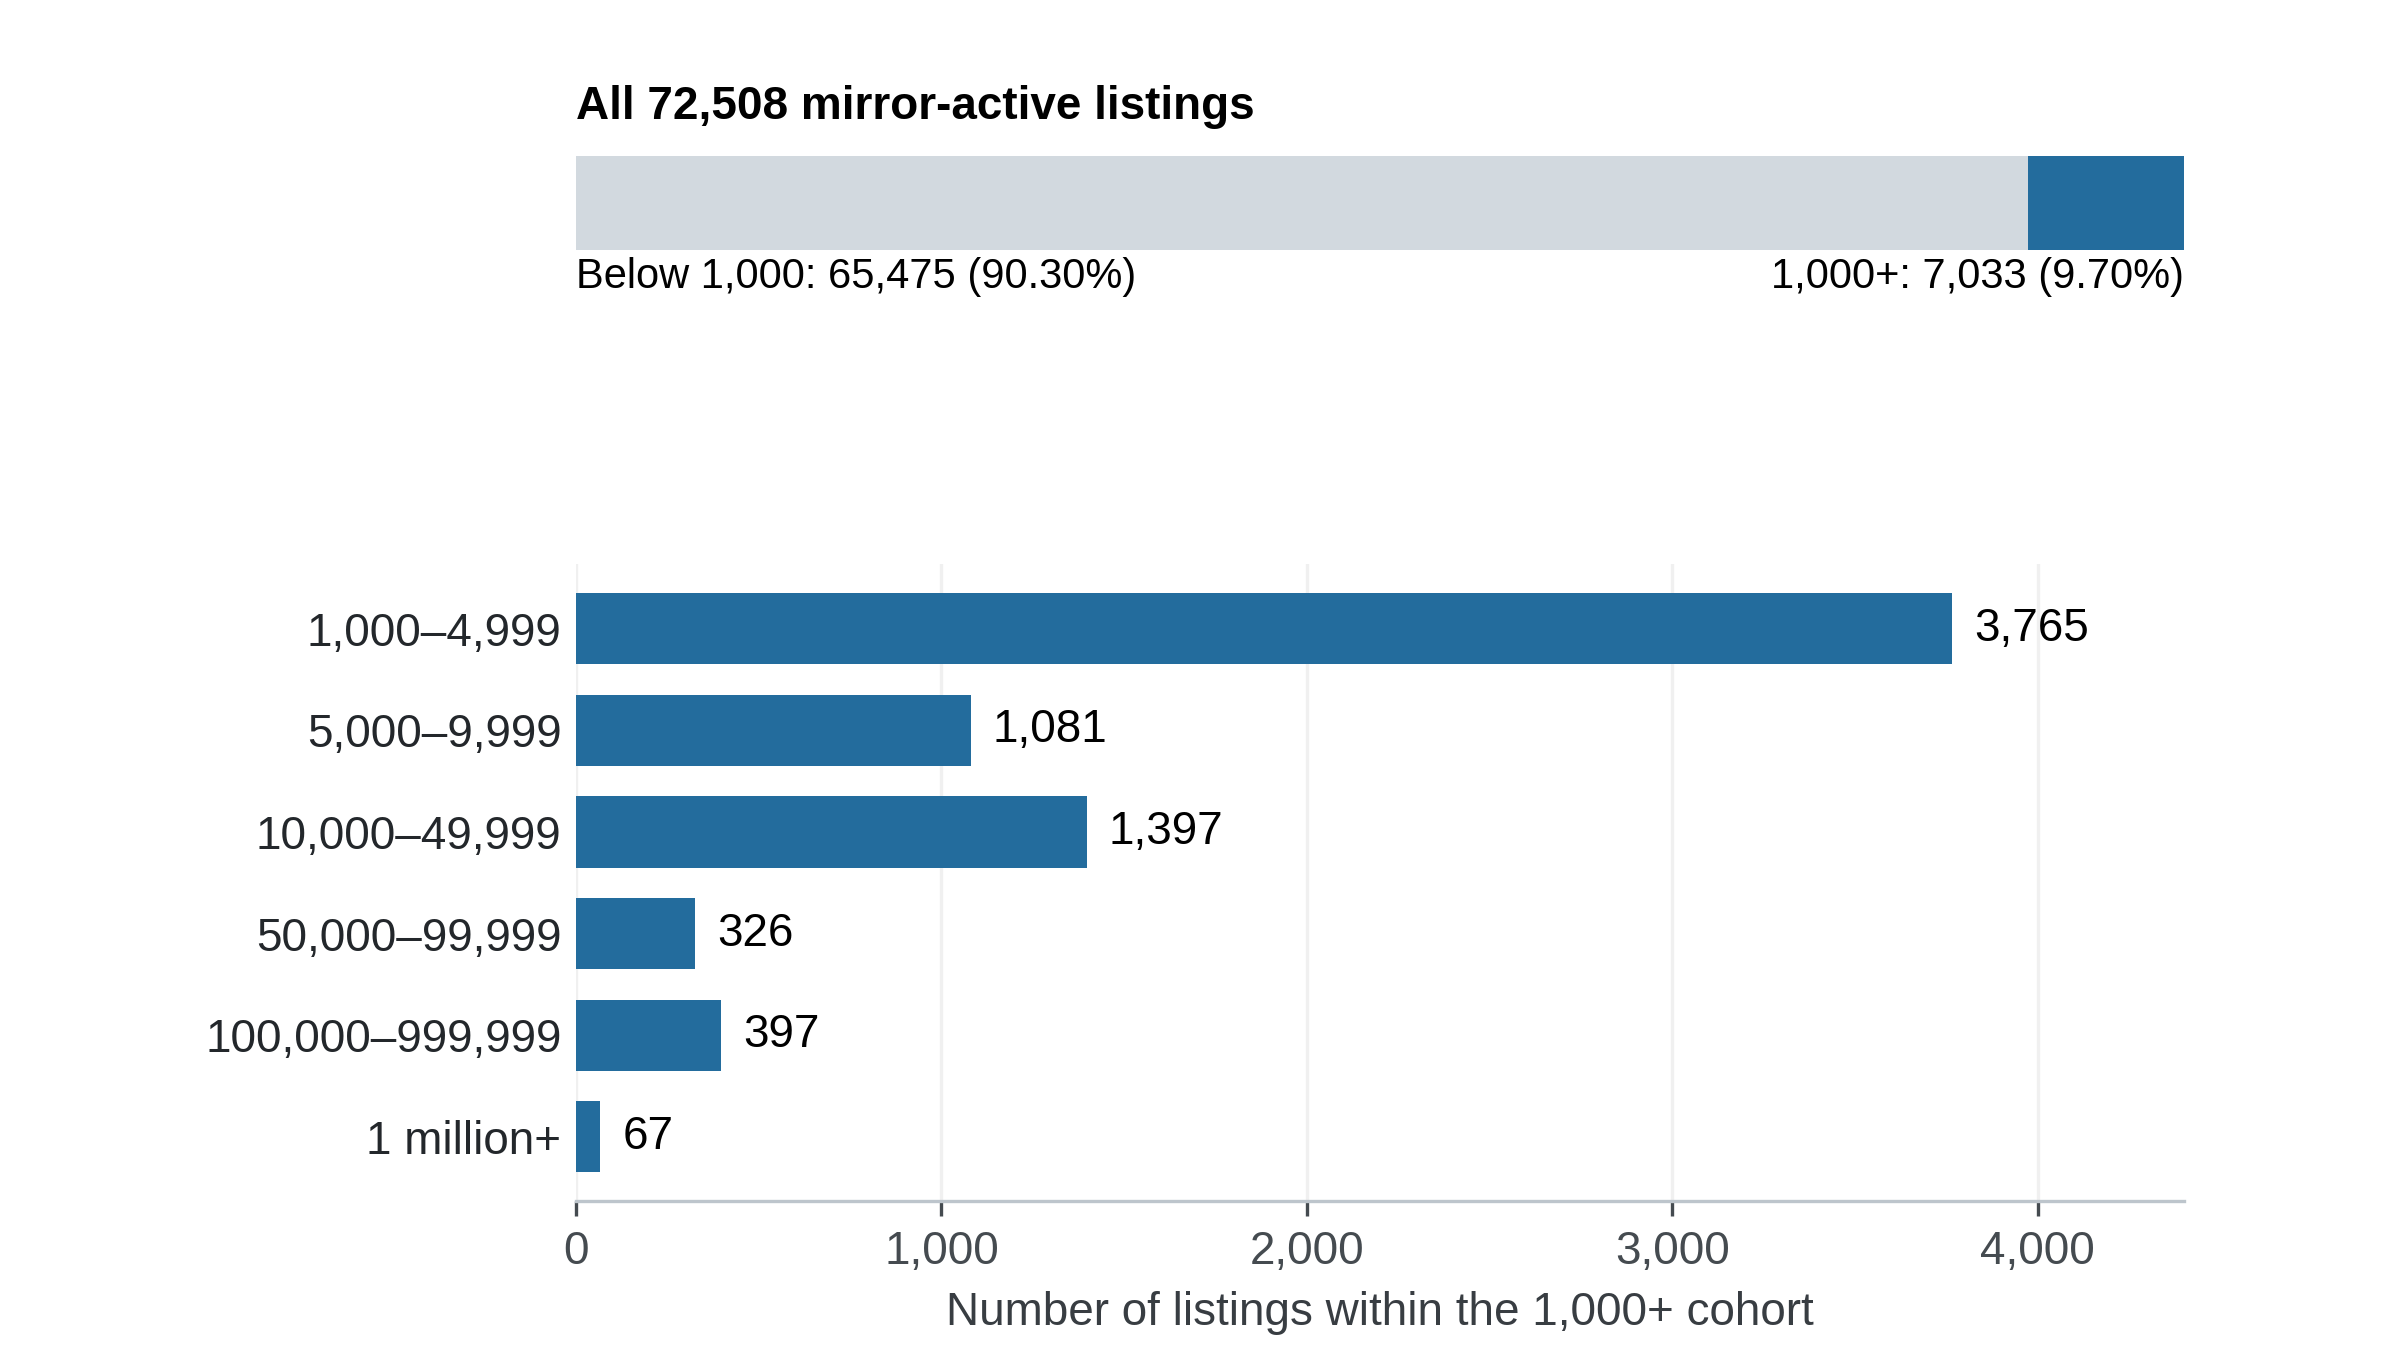
Figure 1. Each listing appears in one band. Shares use all 72,508 listings marked active in the WPInsight mirror. The lower panel expands the 7,033 listings at 1,000+; its bars count listings, not installations.
The largest group is below 1,000: 65,475 listings, or 90.30% of this population. Here is the full breakdown:
| Reported install band | Listings |
|---|---|
| Below 1,000 | 65,475 |
| 1,000 to 4,999 | 3,765 |
| 5,000 to 9,999 | 1,081 |
| 10,000 to 49,999 | 1,397 |
| 50,000 to 99,999 | 326 |
| 100,000 to 999,999 | 397 |
| One million or more | 67 |
If you are comparing milestones, the cumulative counts are useful:
- 10,000+: 2,187 listings, or 3.02% of the mirror-active population.
- 50,000+: 790 listings, or 1.09%.
- 100,000+: 464 listings, or 0.64%.
These are useful reference points for a founder choosing comparable products. If you are building a focused utility, studying the 1,000 to 4,999 band may tell you more about an attainable next stage than looking only at the largest plugins. There are thousands of products in that band to investigate.
The distribution does not tell us why a listing is small. It could be new, narrowly useful, lightly maintained or connected to a business outside the directory. It also does not establish how many businesses succeeded. Those questions need evidence beyond an install bracket.
The number beside the stars changes the picture
The rating score alone leaves out an important part of the story. Across the 7,033 listings at 1,000+ installs, 2,176 had only one to nine ratings. Another 256 had zero, and five had missing rating data. Together, those groups account for 34.65% of the cohort.
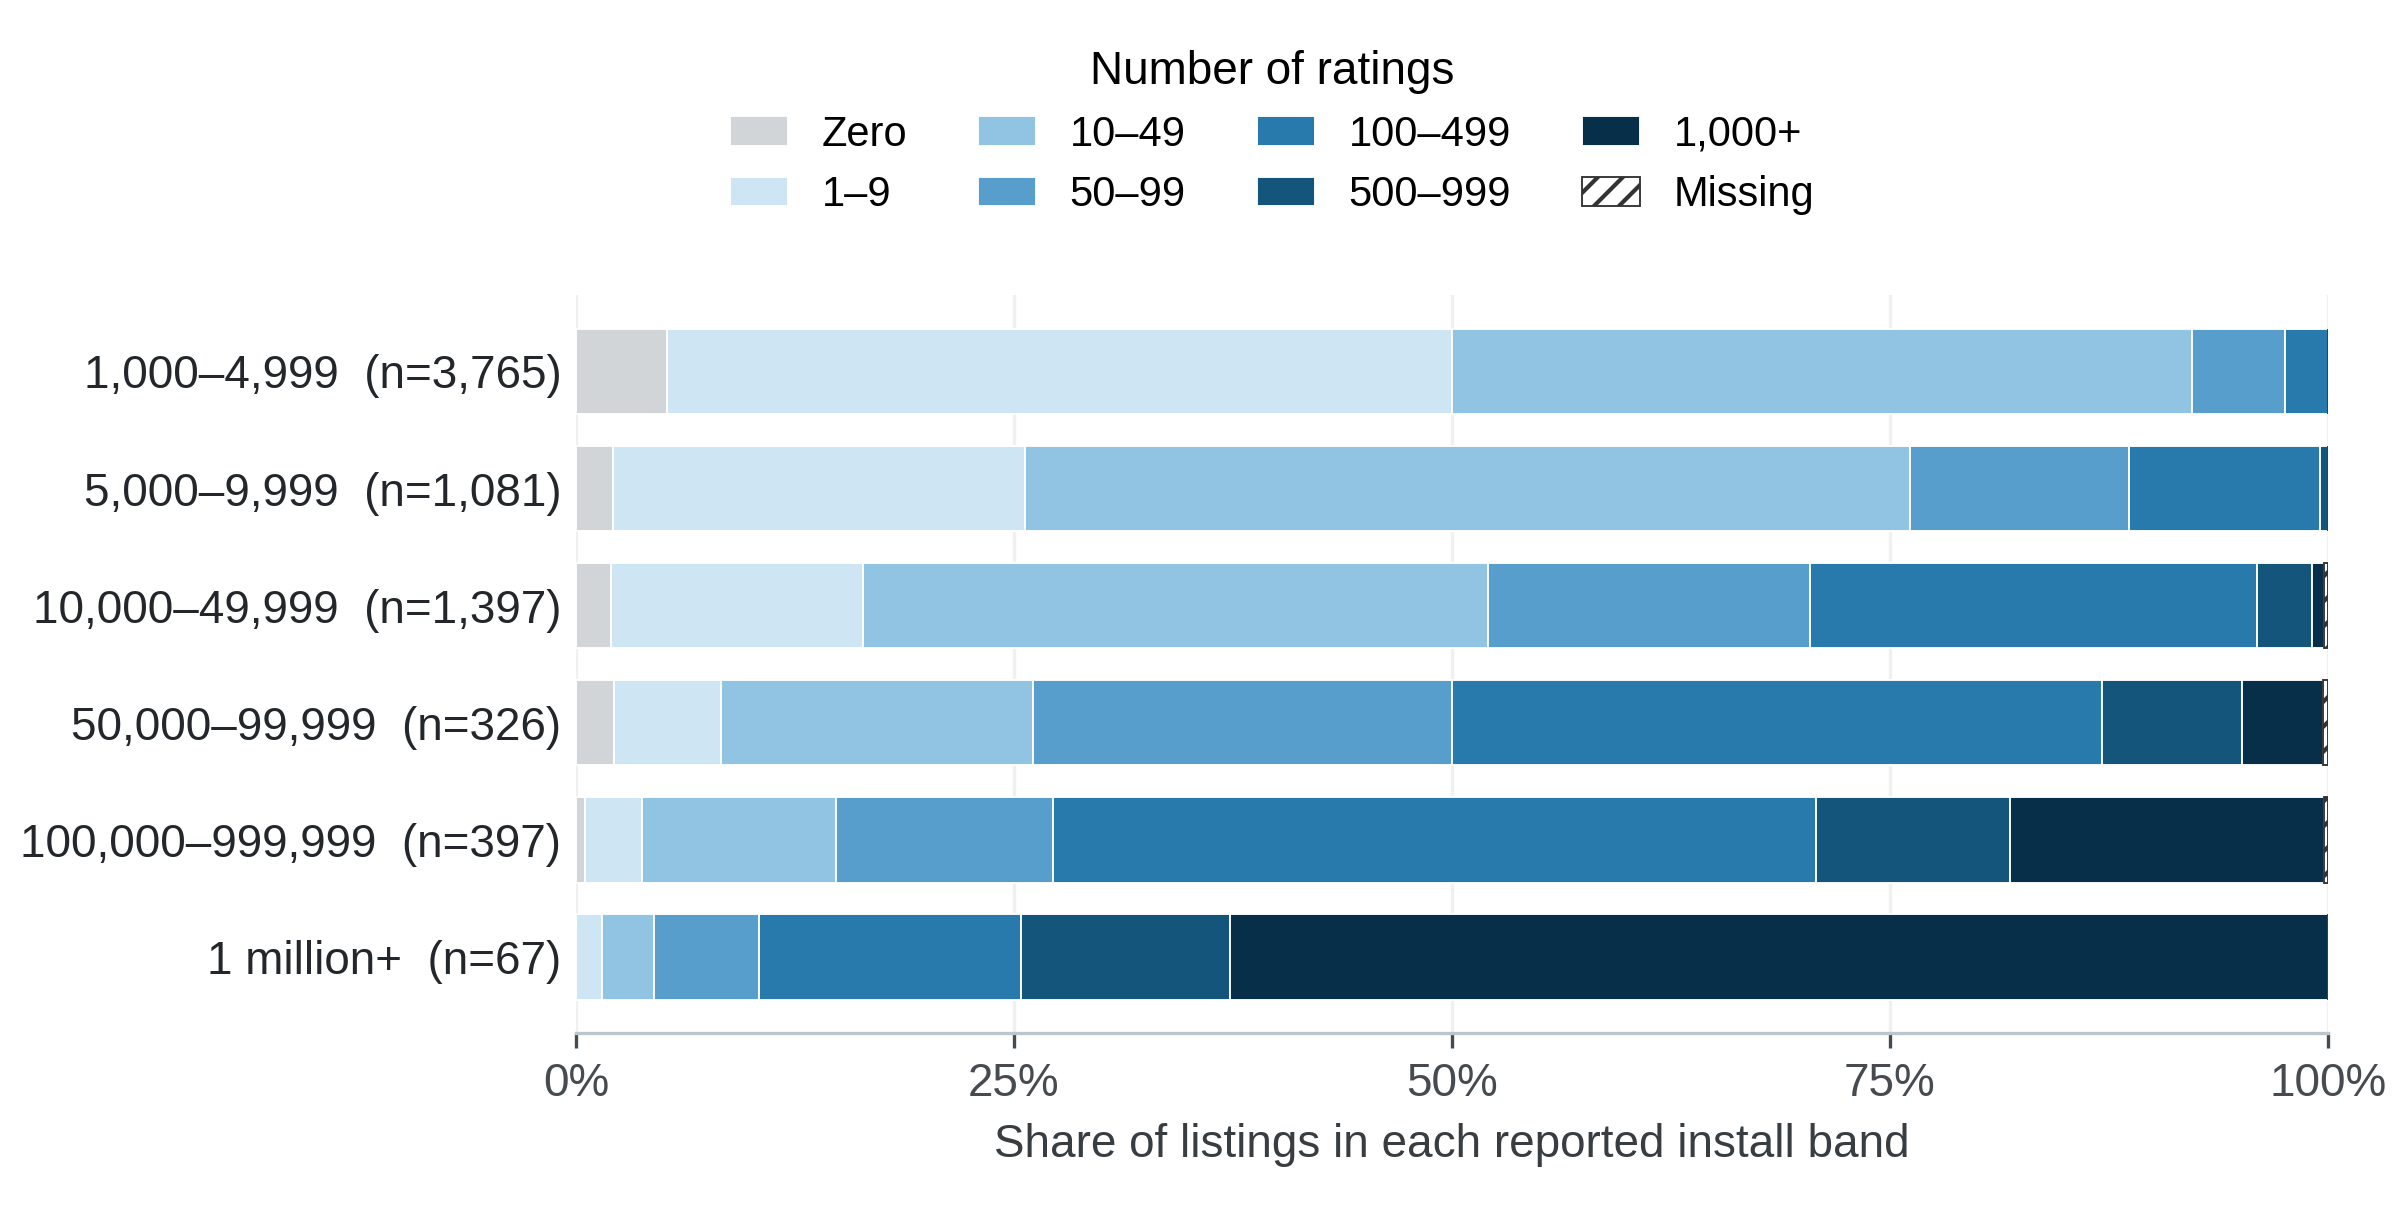
Figure 2. Each bar is 100% of its install band. Zero ratings and missing data remain separate. Counts refer to rating submissions in the metadata, not review texts collected or read for this analysis.
Only 1,136 listings, or 16.15% of the cohort, have 100 or more ratings. Most have much less feedback to work with:
| Number of ratings | Listings |
|---|---|
| Zero | 256 |
| One to nine | 2,176 |
| 10 to 49 | 2,737 |
| 50 to 99 | 723 |
| 100 to 499 | 871 |
| 500 to 999 | 127 |
| At least 1,000 | 138 |
| Missing | Five |
In the 1,000 to 4,999 install band, 1,687 listings have one to nine ratings and another 196 have none. That is 50.01% of the band with fewer than 10. At the other end, 60 of the 67 million-plus listings have at least 100 ratings, and 42 have at least 1,000.
There are exceptions even at the top: one million-plus listing has fewer than 10 ratings. Install scale and rating volume are related in this snapshot, but they are not interchangeable. A large install bracket does not guarantee extensive public feedback.
For a product comparison, I would put the count beside every score. A 4.9 with 200 ratings gives us more feedback history to investigate than a 5.0 with three. Neither number tells us whether the plugin meets the needs of the audience we want to serve.
Typical rating volume rises much faster than the score changes
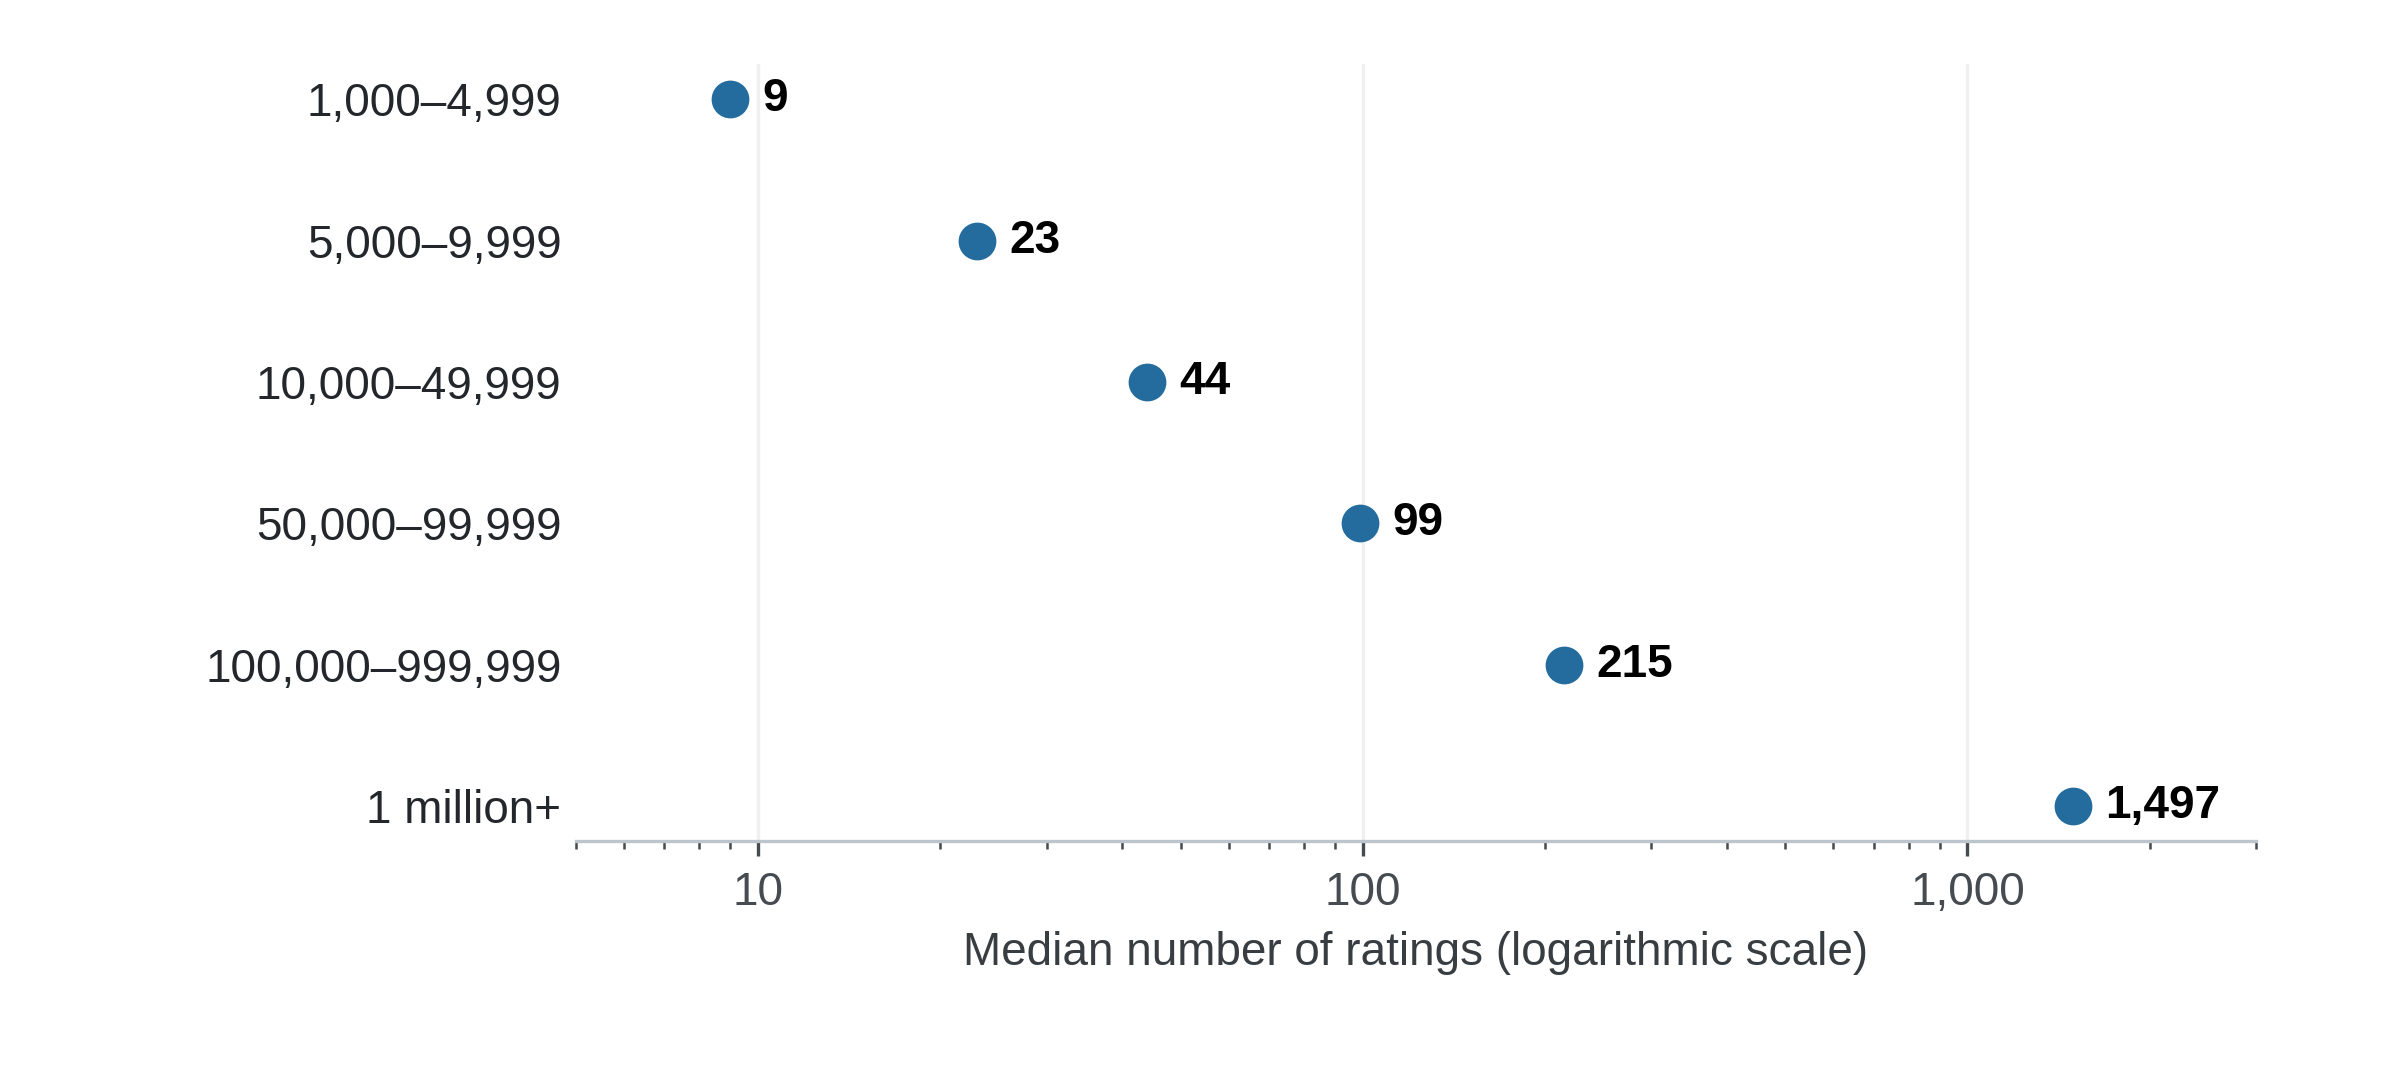
Figure 3. Medians include known zero counts and exclude five missing counts. The horizontal scale is logarithmic so all six medians remain visible; labels show the actual counts.
The median number of ratings rises sharply with the install band:
- 1,000 to 4,999 installs: nine ratings.
- 5,000 to 9,999: 23.
- 10,000 to 49,999: 44.
- 50,000 to 99,999: 99.
- 100,000 to 999,999: 215.
- One million or more: 1,497.
The score itself varies much less. Among listings with at least one rating and a known score, the median source score converted to five stars is 4.7 in the smallest band, 4.6 in the next two, 4.65 at 50,000 to 99,999, and 4.7 in the two largest bands. The 4.65 is a median between source values, not extra measurement precision.
That narrow spread is a reason to avoid ranking opportunities by stars alone. The amount of feedback changes substantially across these bands while the middle score stays close to the same level. Plugin age, audience and use case may contribute to those differences; this collection does not isolate their effects.
There are also 1,064 listings in the cohort with a source score that converts to 5.0 but only one to nine ratings. Those scores reflect only one to nine submitted ratings, not broad feedback from the install base. A perfect-looking average is a starting point for inspection, not enough evidence to call a product the best in its category.
A more useful shortlist combines score and rating count
For a concrete screening rule, consider a source score of at least 4.8 out of five and at least 100 ratings. These are editorial thresholds, not a validated quality measure. They let us ask a narrower question: where do a high score and a substantial amount of feedback appear together?
There are 2,941 listings with a score of at least 4.8 in the 1,000+ install cohort. Requiring at least 100 ratings reduces that group to 489, or 6.95% of the full cohort. Of those, 38 are in the 1,000 to 4,999 install band.
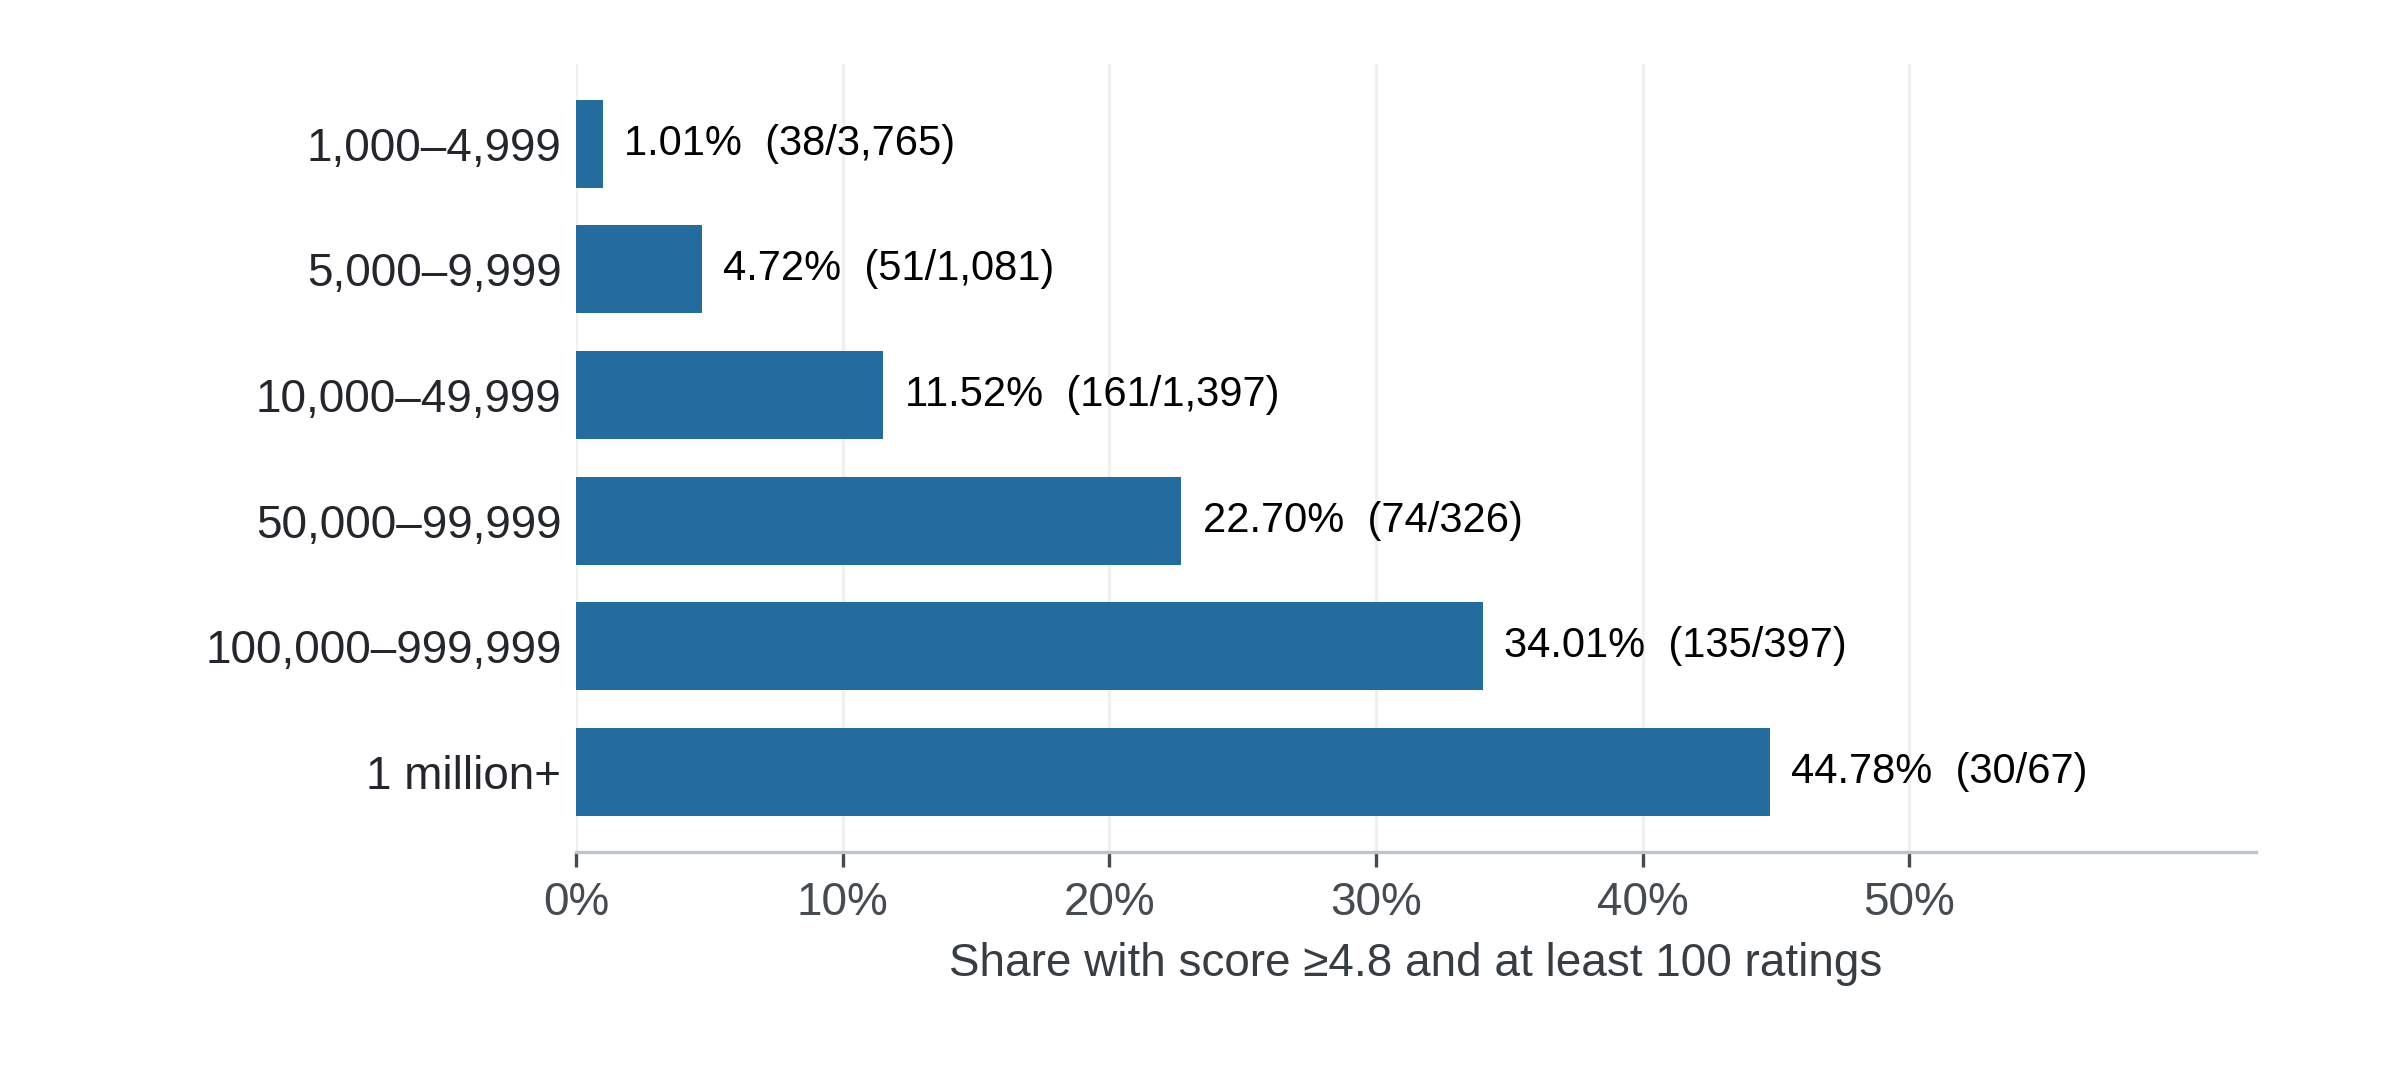
Figure 4. Share of each install band with a source score of at least 4.8 and at least 100 ratings. Labels show qualifying listings divided by all listings in the band. Missing data does not qualify.
Here is how many listings meet both thresholds in each band:
| Reported install band | Qualifying listings | All listings in band |
|---|---|---|
| 1,000 to 4,999 | 38 | 3,765 |
| 5,000 to 9,999 | 51 | 1,081 |
| 10,000 to 49,999 | 161 | 1,397 |
| 50,000 to 99,999 | 74 | 326 |
| 100,000 to 999,999 | 135 | 397 |
| One million or more | 30 | 67 |
Changing the minimum rating count changes the shortlist. With the same 4.8 score threshold:
- At least 20 ratings returns 1,301 listings.
- At least 50 ratings returns 747.
- At least 100 ratings returns 489.
There is no single correct cutoff for every research question. A higher minimum gives us more rating history per candidate but leaves out newer or narrower products that may still be worth studying.
The smaller-band examples are particularly useful for putting opportunity in perspective. Simple Ajax Chat and Photo Engine both report a 2,000+ install floor, a 4.9 score and more than 200 ratings. They are concrete examples of smaller install brackets with substantial positive rating history.
| Plugin | Reported install floor | Score out of 5 | Rating count |
|---|---|---|---|
| Simple Ajax Chat | 2,000+ | 4.9 | 215 |
| Photo Engine | 2,000+ | 4.9 | 210 |
| Relevanssi | 100,000+ | 4.8 | 406 |
| Query Monitor | 200,000+ | 4.9 | 470 |
| Classic Editor | 8,000,000+ | 4.9 | 1,251 |
Illustrative selections, not a ranking or endorsement. Figures come from the same WPInsight collection as the charts. Linked official listings were checked separately for availability. Different products serve different purposes, so the table should not be read as a like-for-like quality comparison.
These examples show why it is worth looking beyond the biggest install numbers. They do not establish an underserved market, willingness to pay or a gap in the existing products. To learn that, the next step is to examine the actual work each plugin supports and read the feedback in context.
Turn the benchmark into a focused research question
I would start with a specific workflow and compare plugins at several install levels:
- Record the install bracket, score and rating count together.
- Read recent positive and critical reviews.
- Look at the support discussions.
- Check the current product and maintenance status on WordPress.org.
This analysis uses rating metadata. It has not classified those review texts or support conversations.
For a smaller plugin with strong ratings, the useful question is what its users value enough to describe. For a larger plugin with a long feedback history, it is whether a recurring problem affects the particular audience you understand. A complaint only becomes an opportunity hypothesis when it is specific, repeated and relevant to that audience. It still needs direct validation.
The data gives us a better place to begin. In this mirror, 5,000+ installs is already an uncommon milestone. The typical 1,000+ listing has only 17 ratings. And 38 listings in the 1,000 to 4,999 band combine at least 4.8 stars with 100 or more ratings. Those are more useful reference points than treating millions of installs as the minimum worth studying.
Use WPInsight’s leaderboard to find comparable products, then use their official listings and direct user research to understand the need. The opportunity is in the problem you can verify and solve, not in the size of the headline number.
Sources and methodology
What we collected
The main population is 72,508 listings marked active in the WPInsight public mirror on October 29, 2026.
- Source: the public ranking endpoint, sorted by descending reported installs.
- Collection: seventy-two consecutive pages returned 7,200 rows between 18:21:44 and 18:30:32 UTC, reaching a reported install floor of 900.
- Rating cohort: filtering at 1,000 or more produced the complete 7,033-listing cohort used for the rating analysis.
- Below 1,000: this count is the total minus that cohort. Rating results are not extrapolated to it.
The full stored mirror contains 76,143 records, including inactive mirror records. We excluded inactive records and used the 72,508 mirror-active population throughout, including 3,268 listings at 5,000+.
Mirror-active status does not guarantee that a listing remains open on WordPress.org. Aggregates retain all eligible records; named examples are illustrative rather than a representative sample.
Checks and freshness limits
Every response reported the same population total. We also checked that:
- There were no duplicate slugs or install-order breaks.
- Independent threshold queries reconciled the 5,000+, 10,000+ and 50,000+ counts.
- Available star-histogram totals reconciled with the rating counts.
This was a non-atomic collection over several minutes, not a frozen database snapshot. Underlying mirror observations may be older. The public lastUpdated field describes the source plugin update, not when WPInsight fetched the record, so it cannot establish observation freshness.
How the figures were calculated
- Install bands: thresholds are inclusive reported floors. Bands do not overlap, and no install values are summed into a total audience.
- Rating scores: the rounded source 0-to-100 score is divided by 20. It is not an exact underlying mean.
- Rating counts: counts use
numRatings. Zero ratings remain zero counts; they are not interpreted as zero-star scores. The five missing rating records stay separate. - Medians: score medians exclude unrated and missing records. Count medians include known zeros and exclude missing values.
- Percentages: rounded to two decimals.
What these figures cannot tell us
The figures describe listings and submitted ratings. They do not measure:
- Unique users or paid customers.
- Revenue or retention.
- Review response rates or market demand.
- The satisfaction of everyone using a plugin.
Use them for comparison and candidate research, not causal conclusions or investment forecasts.