Overview
Dashboard
3 min read
The dashboard is your portfolio at a glance. Every number is computed live from the plugins you track — no extra setup, and it always stays in sync with the rest of the app.
Wonder what KPI row actually shows?
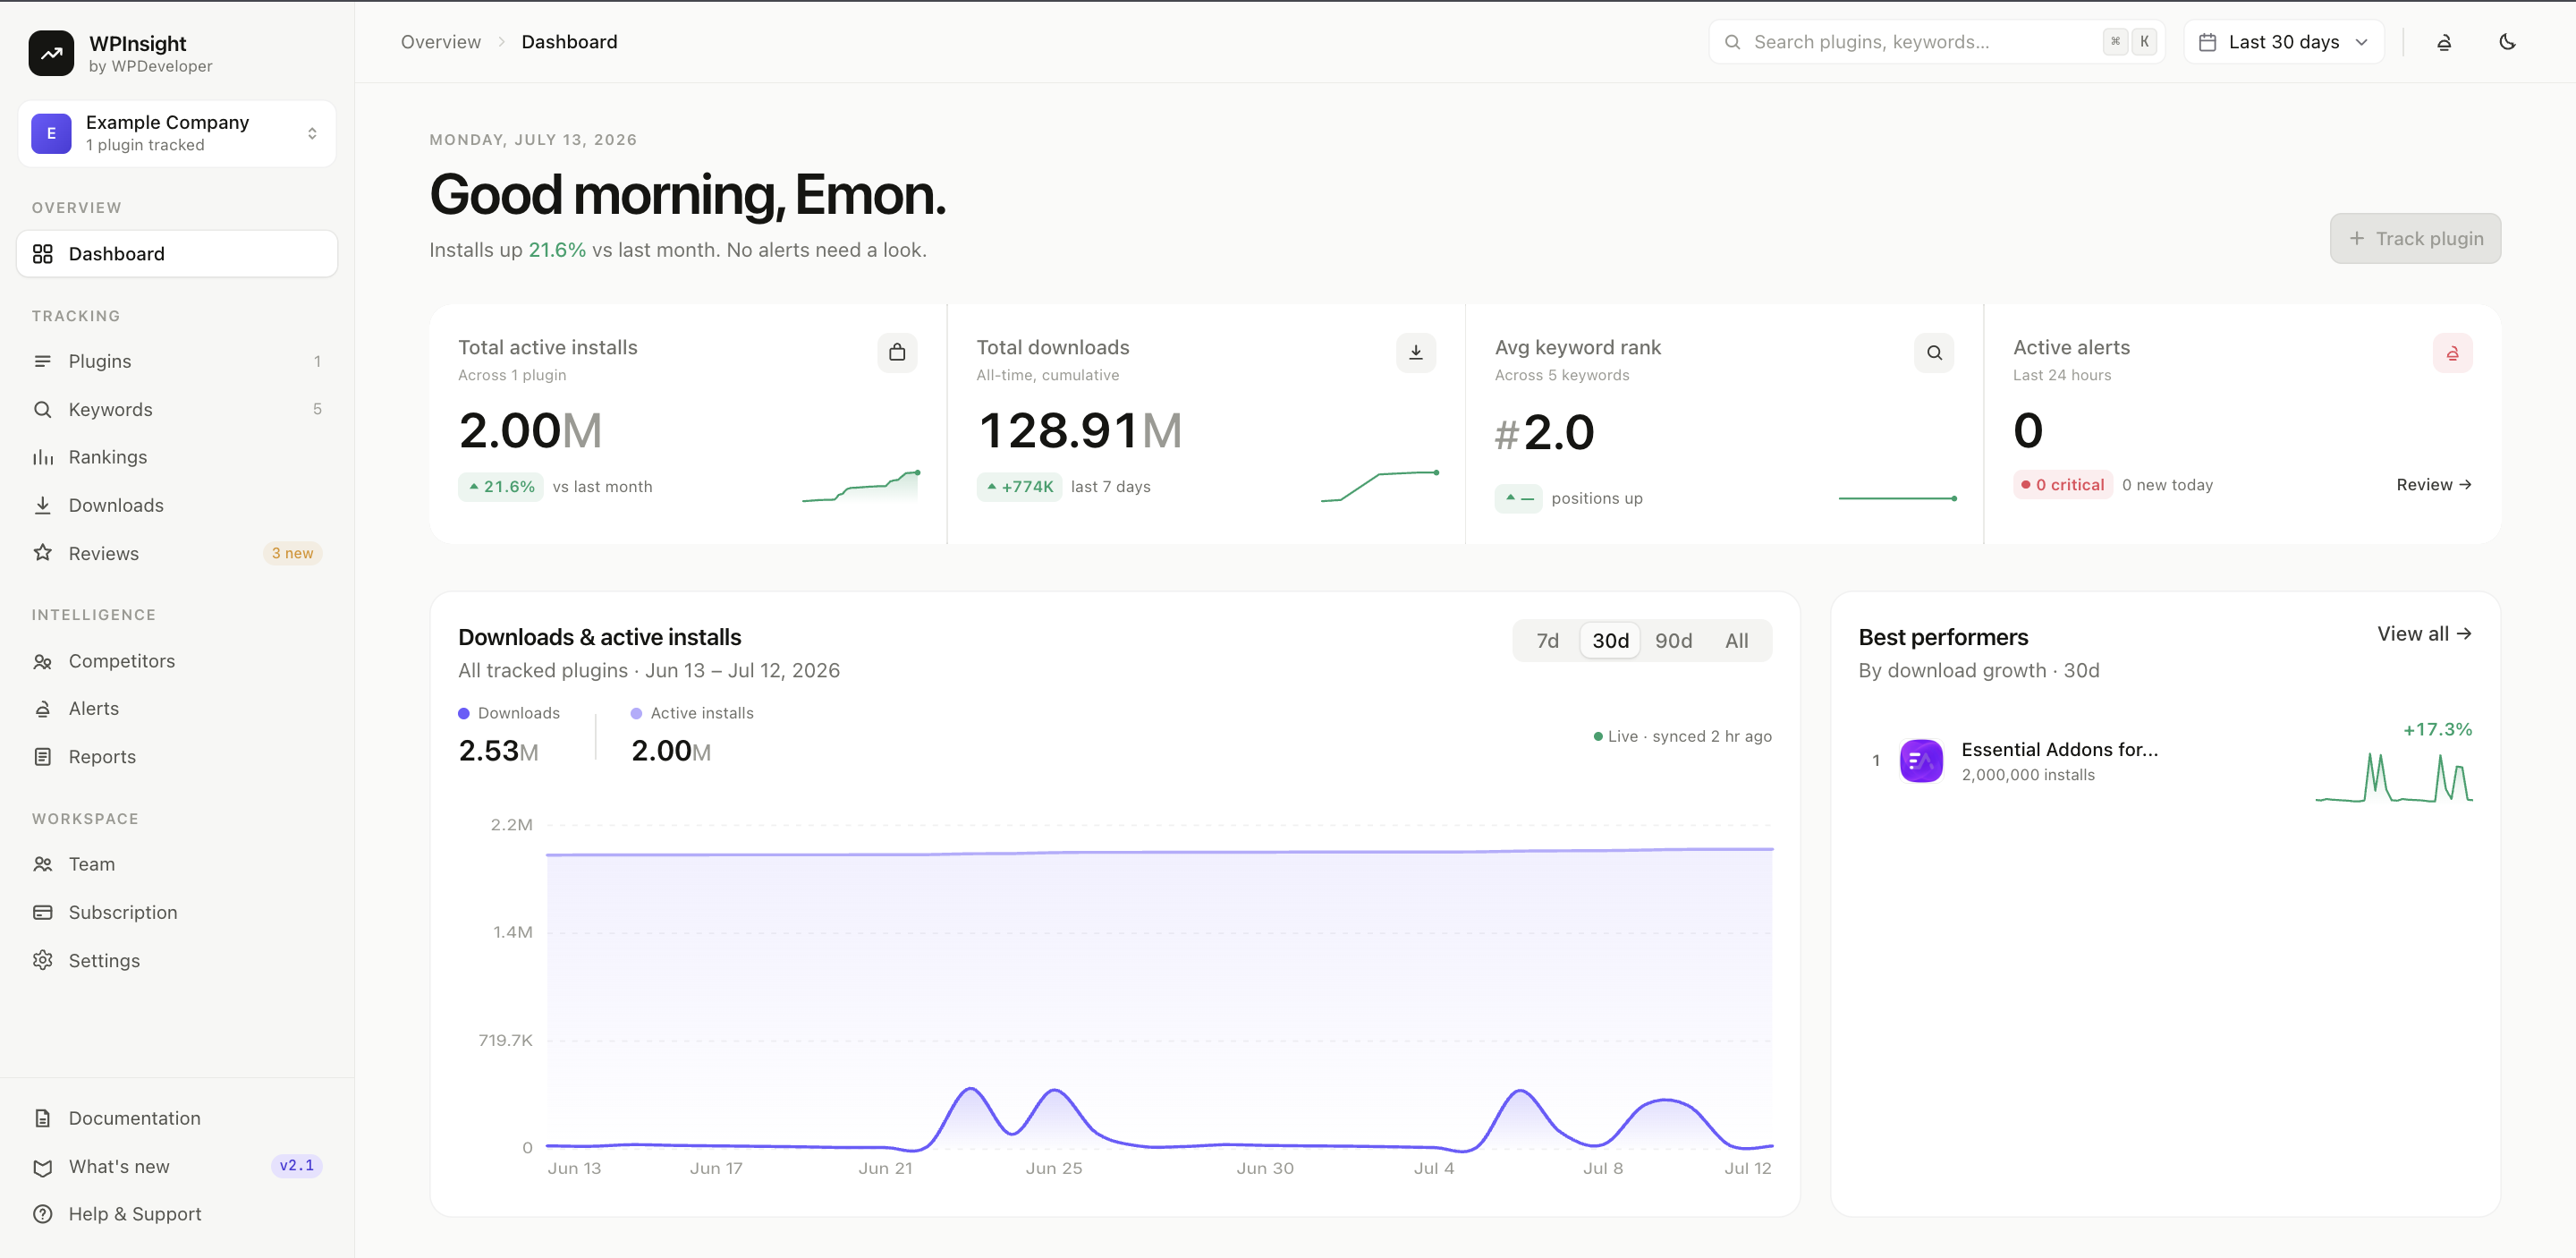
Four headline tiles sit at the top, each with a number, a trend, and a mini sparkline:
- Total active installs — combined active installs across all your plugins.
- Total downloads — combined downloads across your portfolio.
- Avg keyword rank — your mean position across all tracked keywords.
- Active alerts — how many alerts need attention in the last 24 hours.
Understanding the Downloads & Installs chart
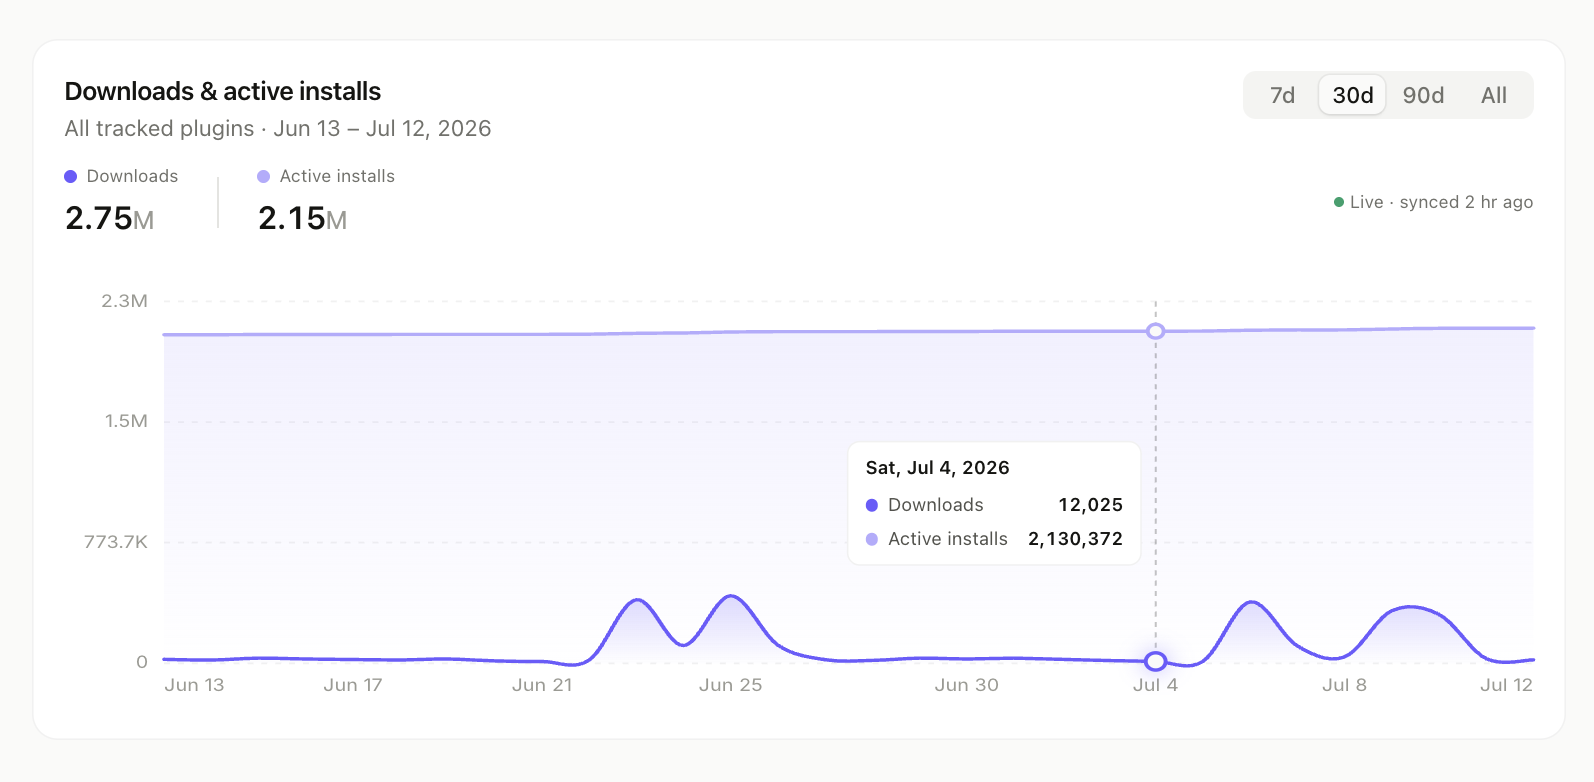
A single chart plots total downloads and total active installs together. Use the segmented control to switch the window:
7d·30d·90d·All
The chart re-derives both lines instantly from your download history — no extra loading.
What “Best performers” shows
The top 5 plugins by 30-day download growth, so you can see what’s working without scrolling the full table.
About the “Top Gainers” and “Needs Attention” sections
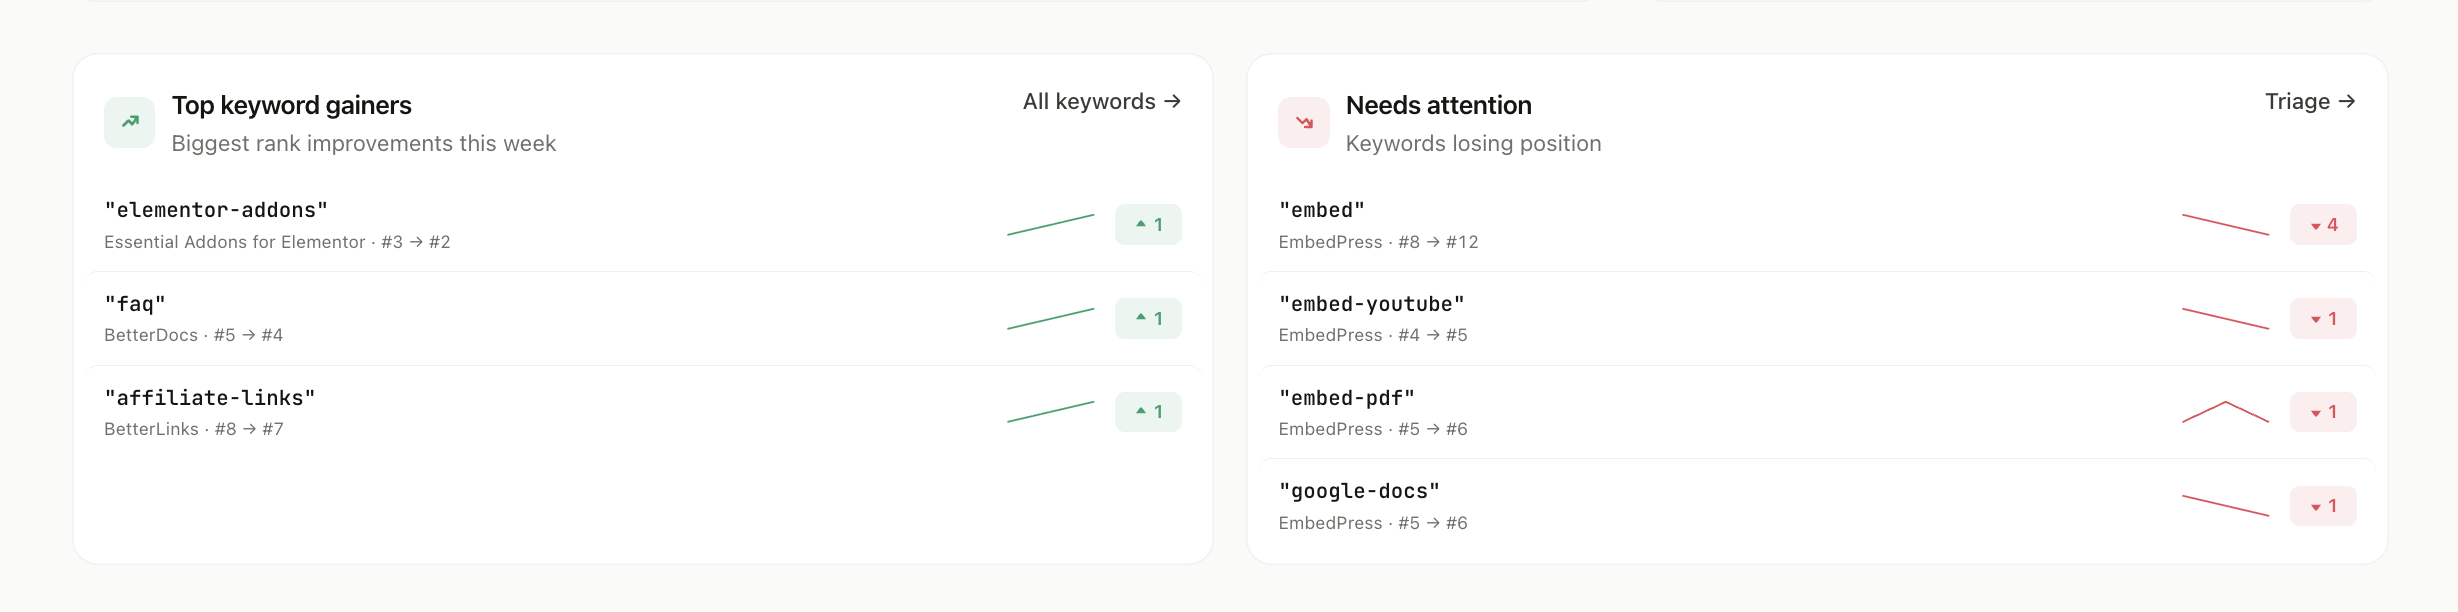
Two mirrored cards on keyword movement:
- Top keyword gainers — the keywords that climbed the most recently.
- Needs attention — the keywords that slipped the most recently. This is your triage list: catch a ranking drop here before it shows up as a download dip.
Per-plugin table overview
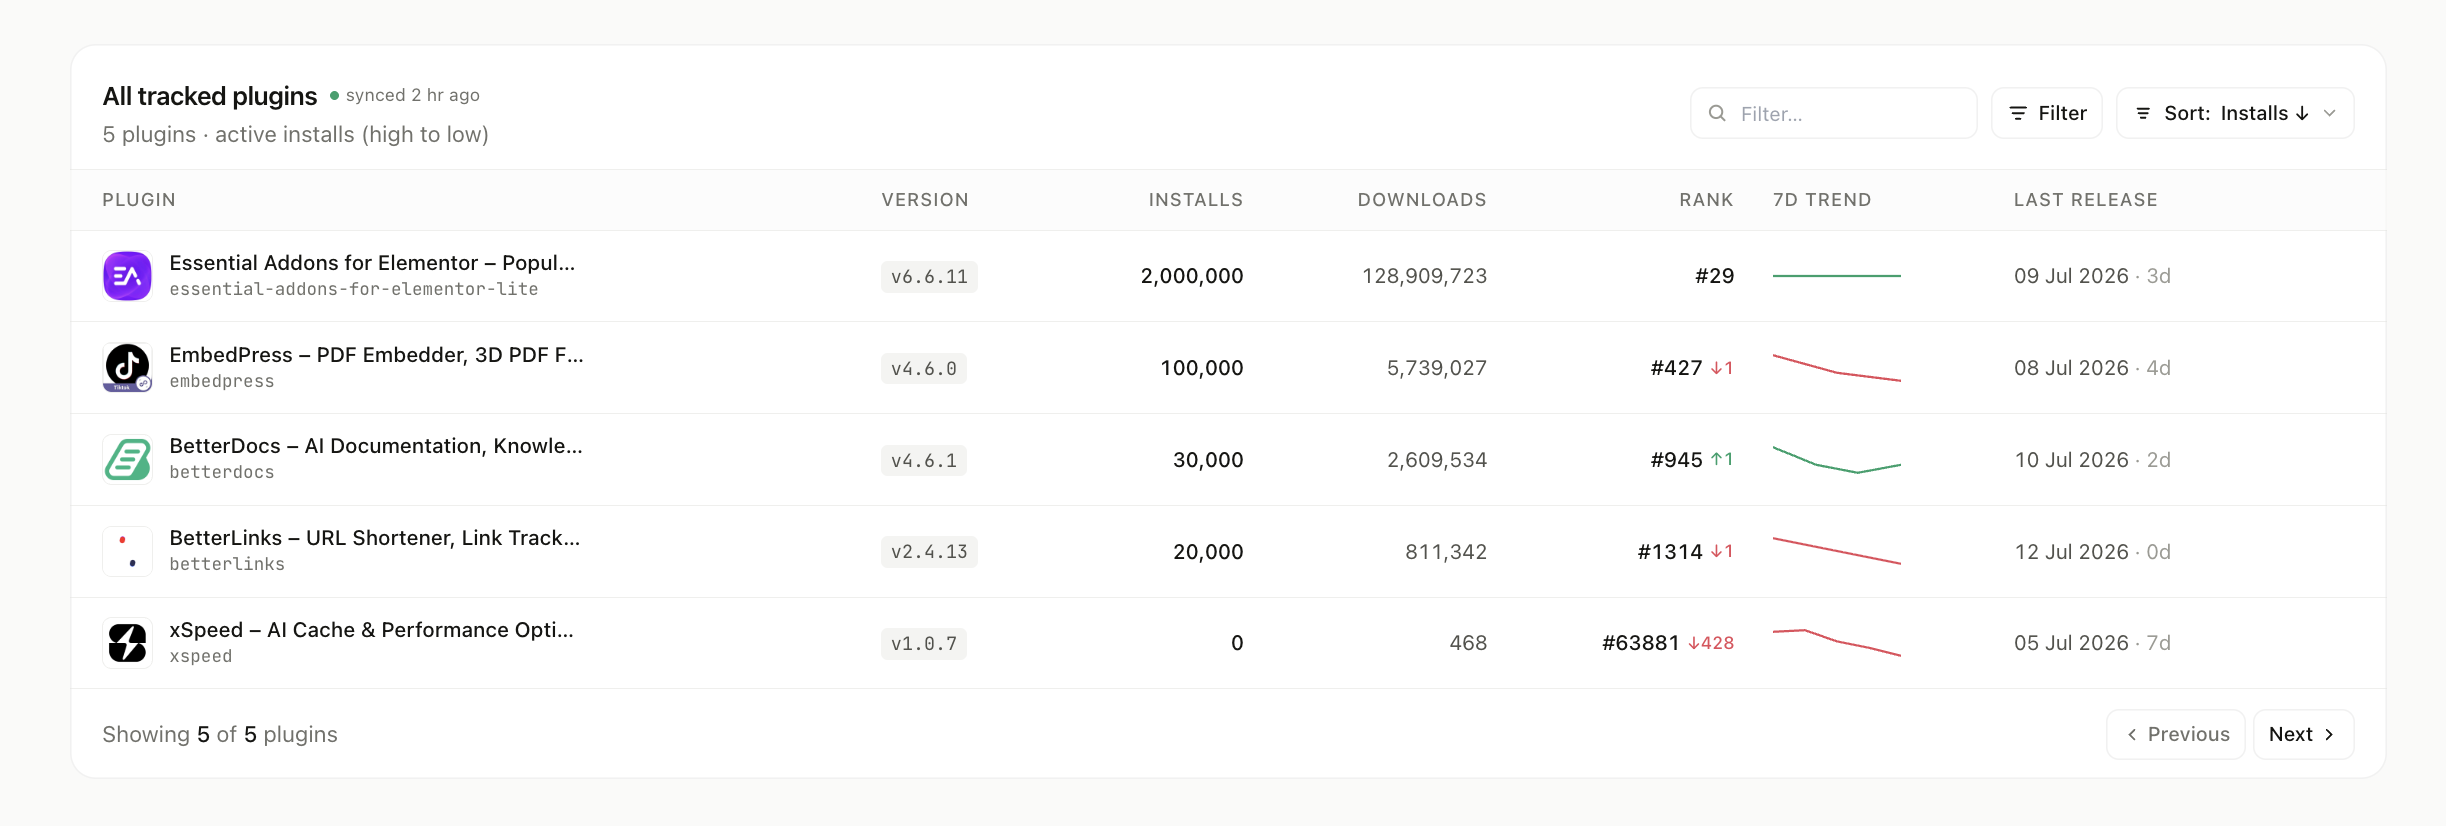
Below the widgets, a full table lists every tracked plugin with its key metrics, so the dashboard doubles as a quick jump-off point into any plugin’s detail page.